OpenStreetMap Data Analysis
bit.ly/osm-analysis-blrBackground

Studied Math & Computer Science
Wondered:
Is there an intersection of people + technology + social good?
About Me
PhD Student at University of Colorado Boulder
Human-Computer-Interaction: Crisis Informatics
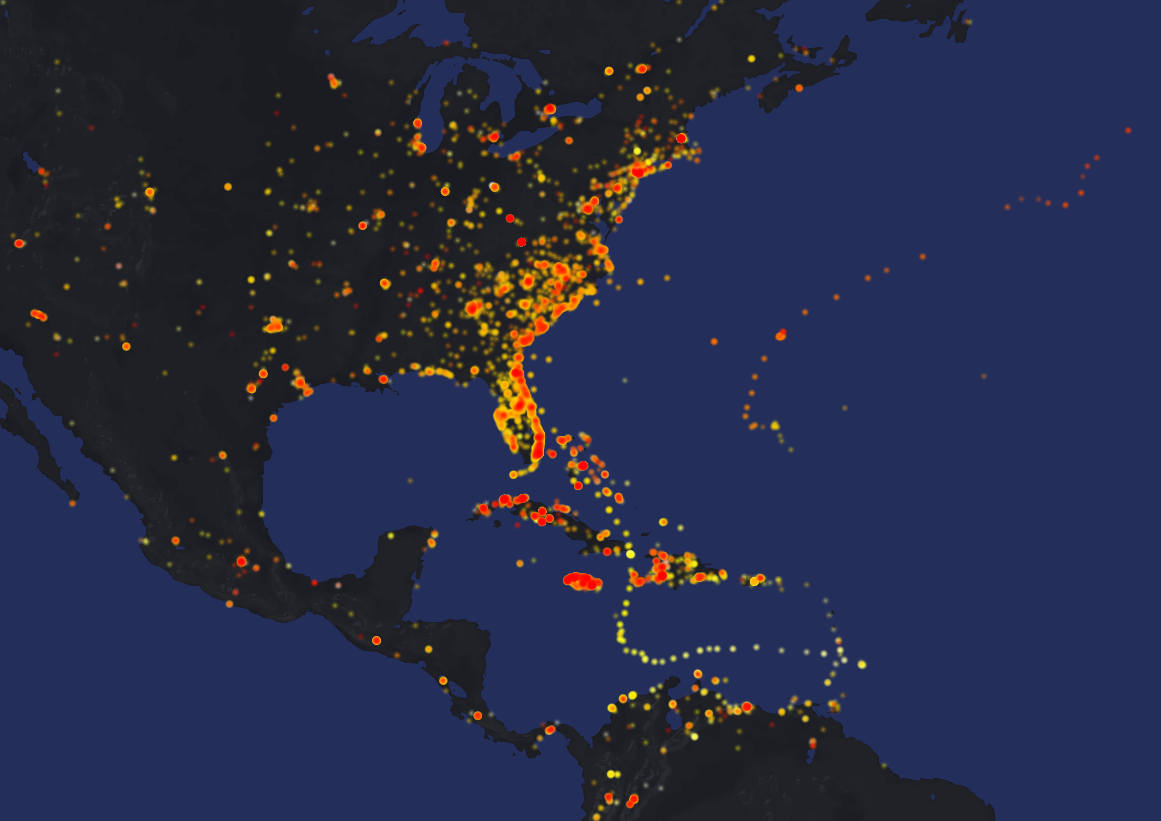
Crisis Informatics
Diaster Mapping

Haiti Earthquake 2010

Typhoon Yolanda 2013 (Philippines)

Nepal Earthquake 2015
4 Billion
Geographic Points
Roads
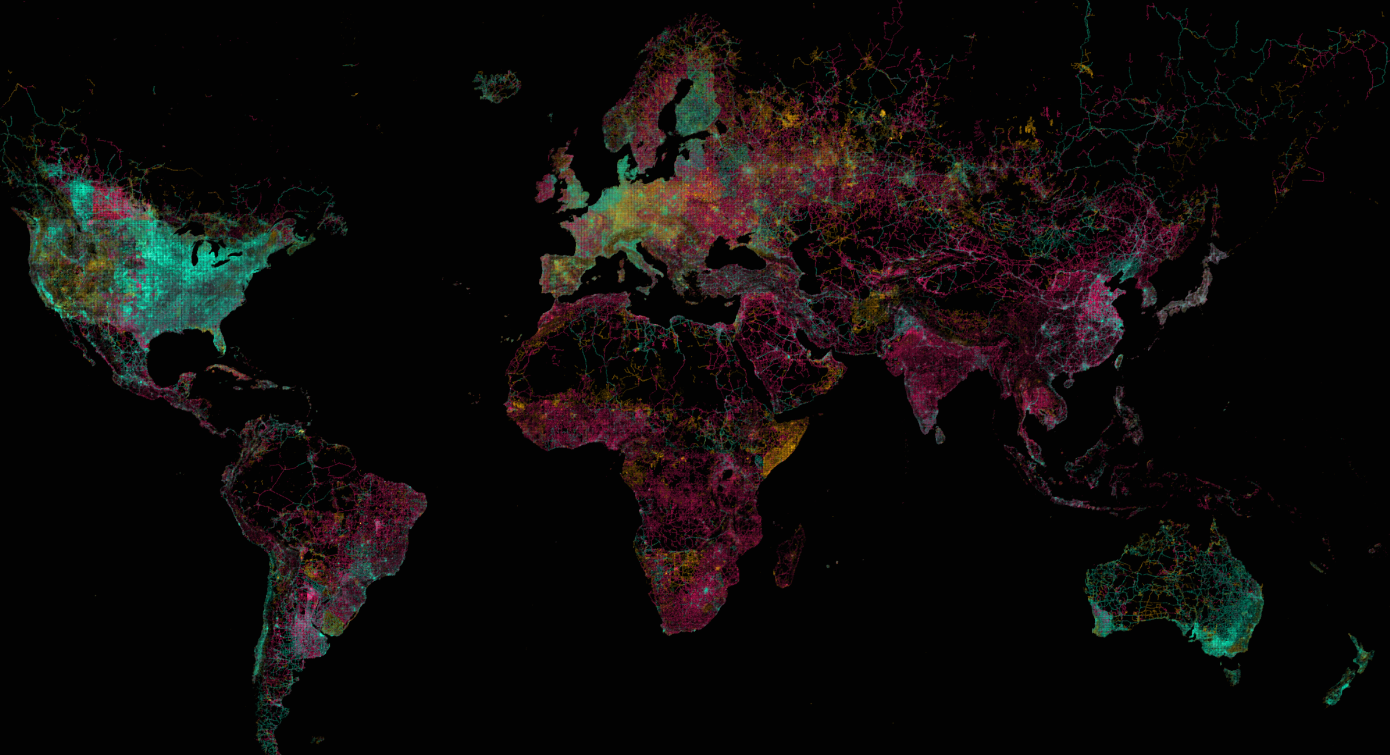
Map Data © OpenStreetMap Contributors
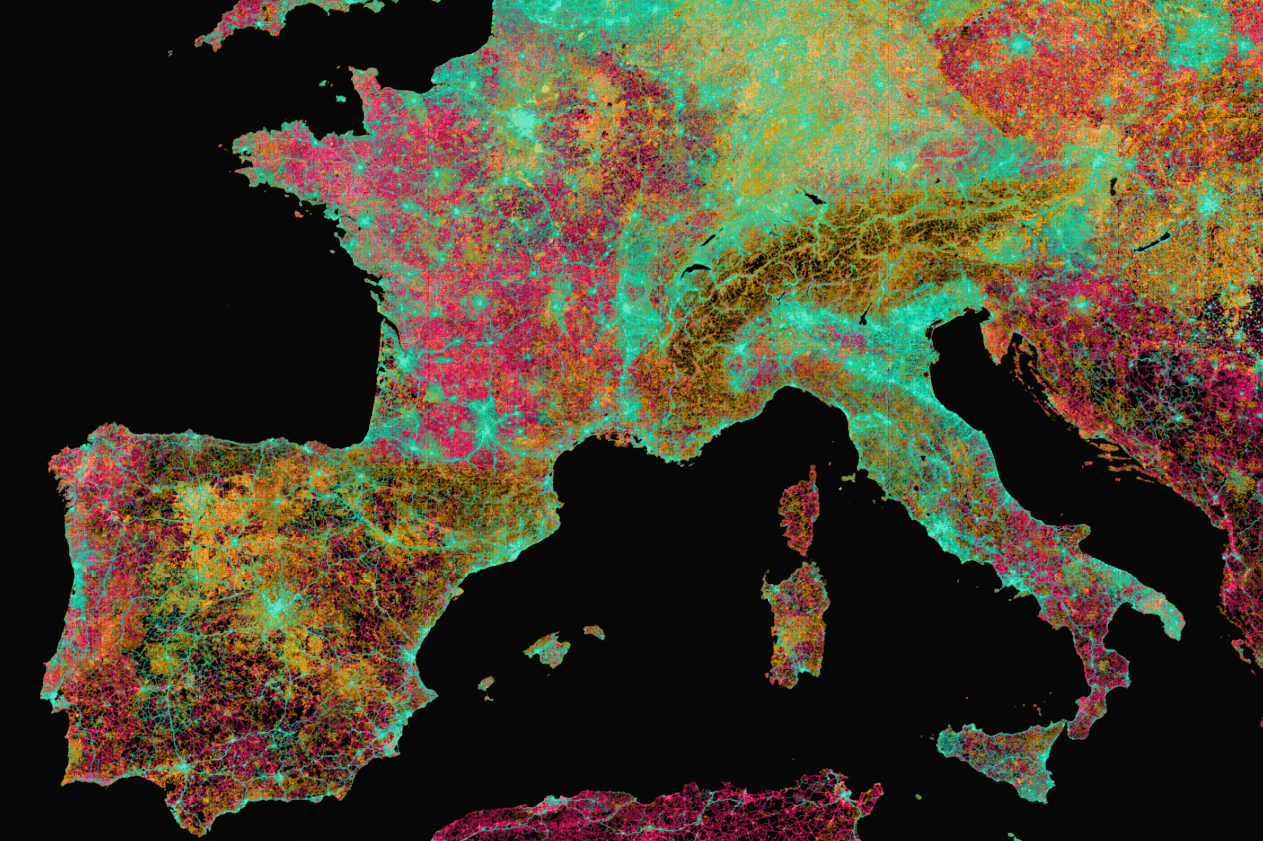
Map Data © OpenStreetMap Contributors
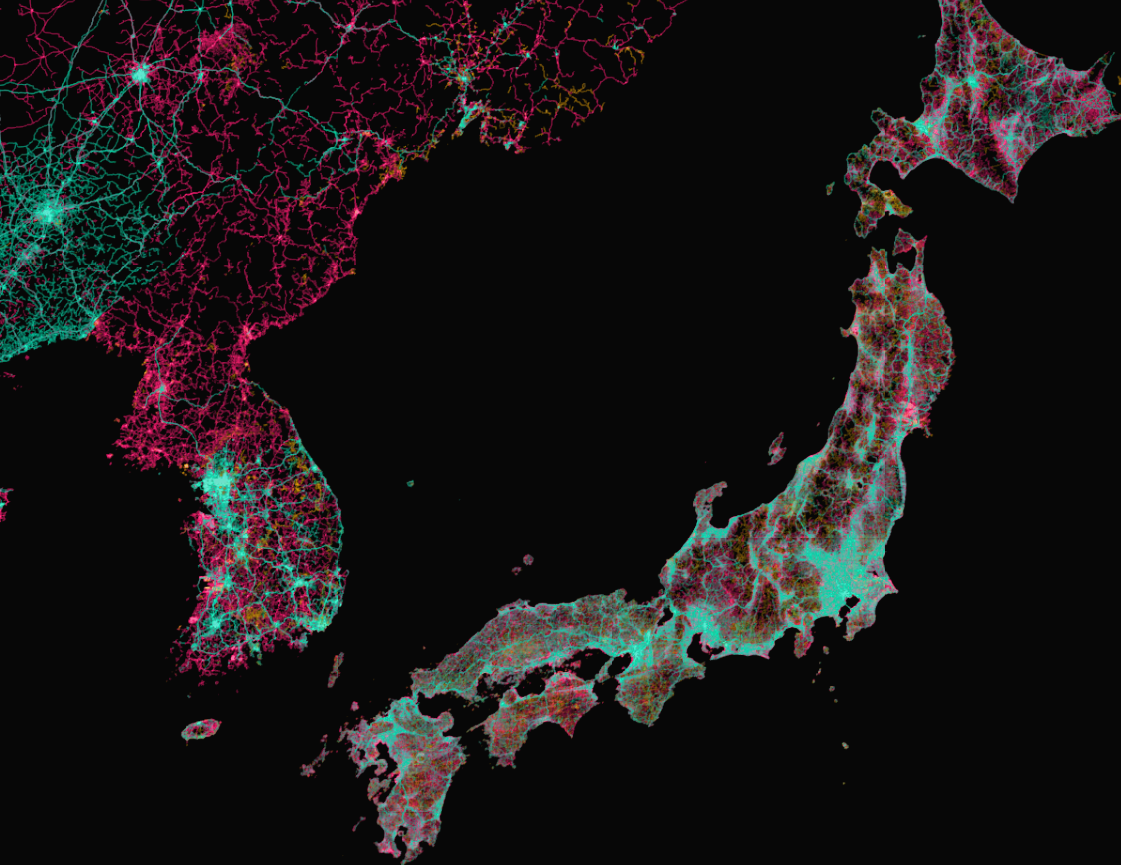
Map Data © OpenStreetMap Contributors
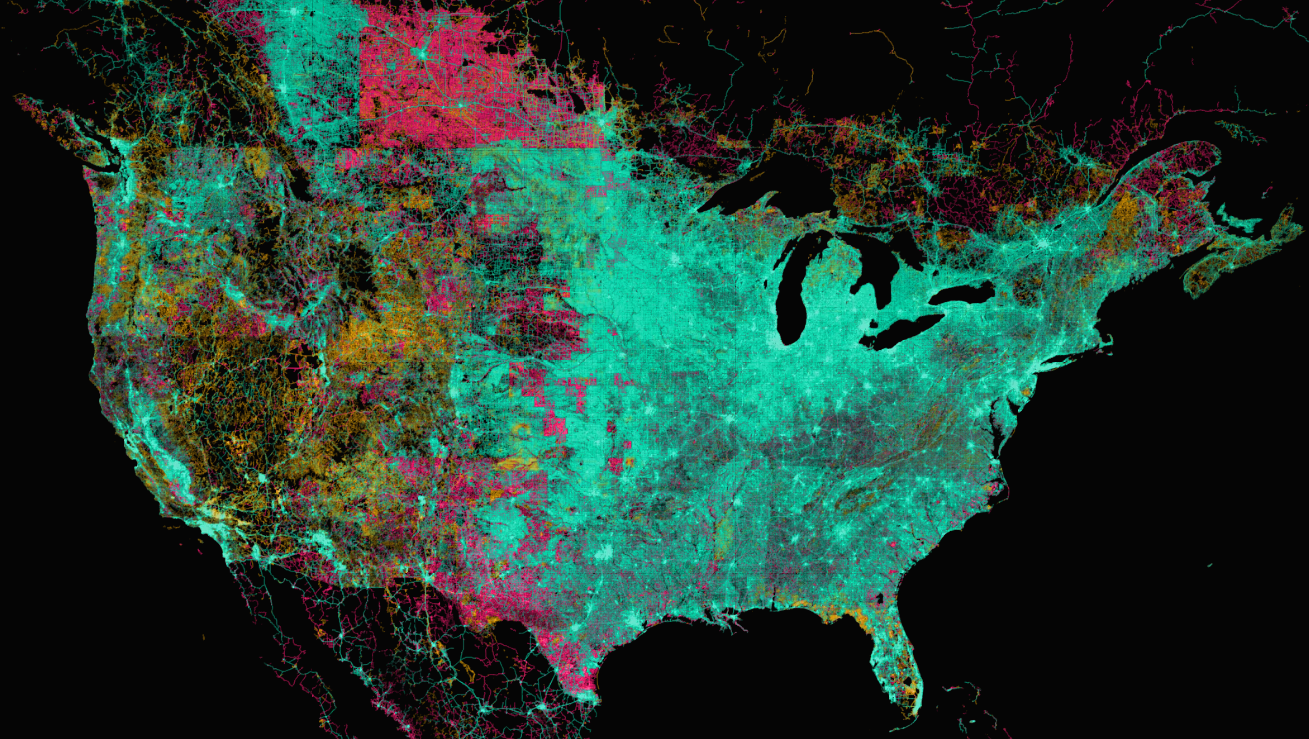
Map Data © OpenStreetMap Contributors
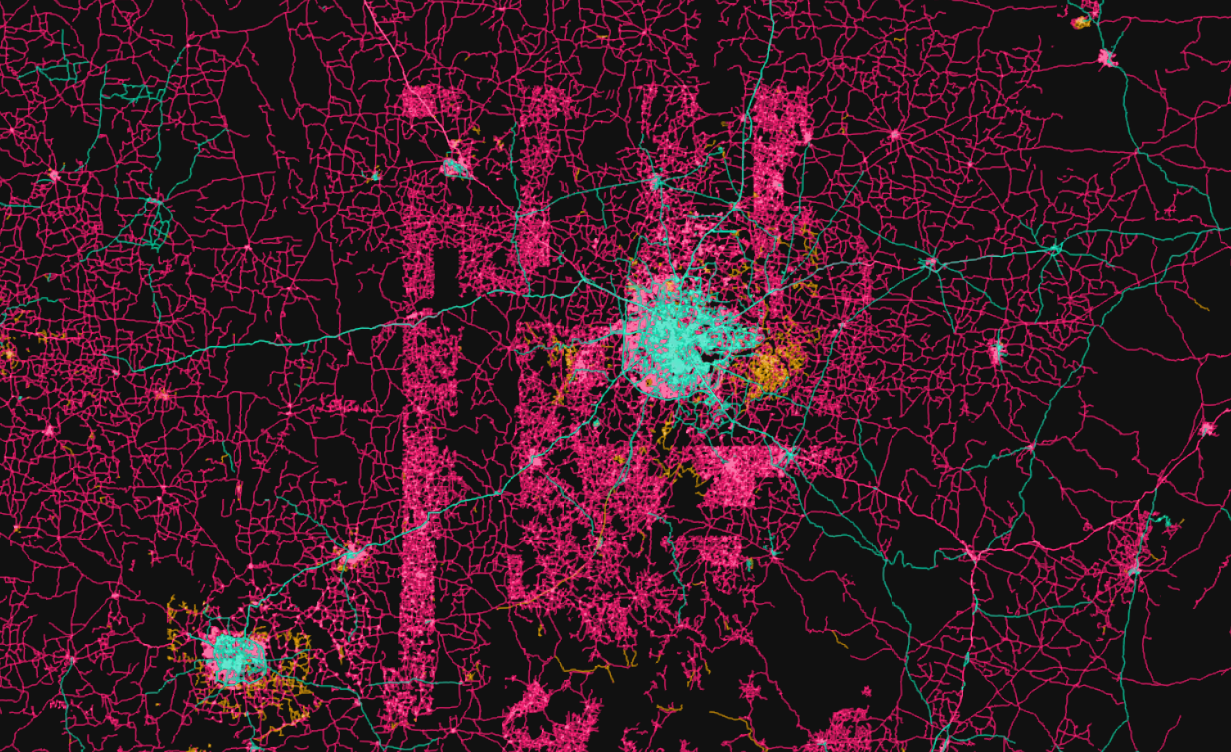
Map Data © OpenStreetMap Contributors
Buildings
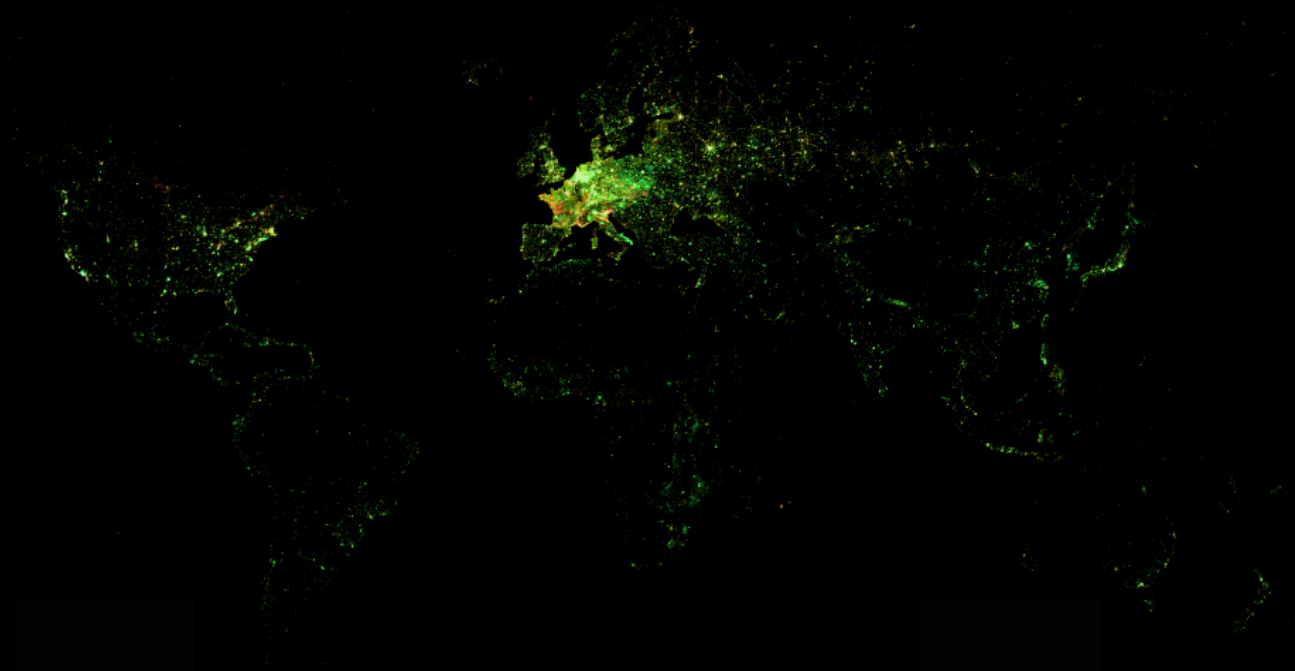
© OpenStreetMap Contributors
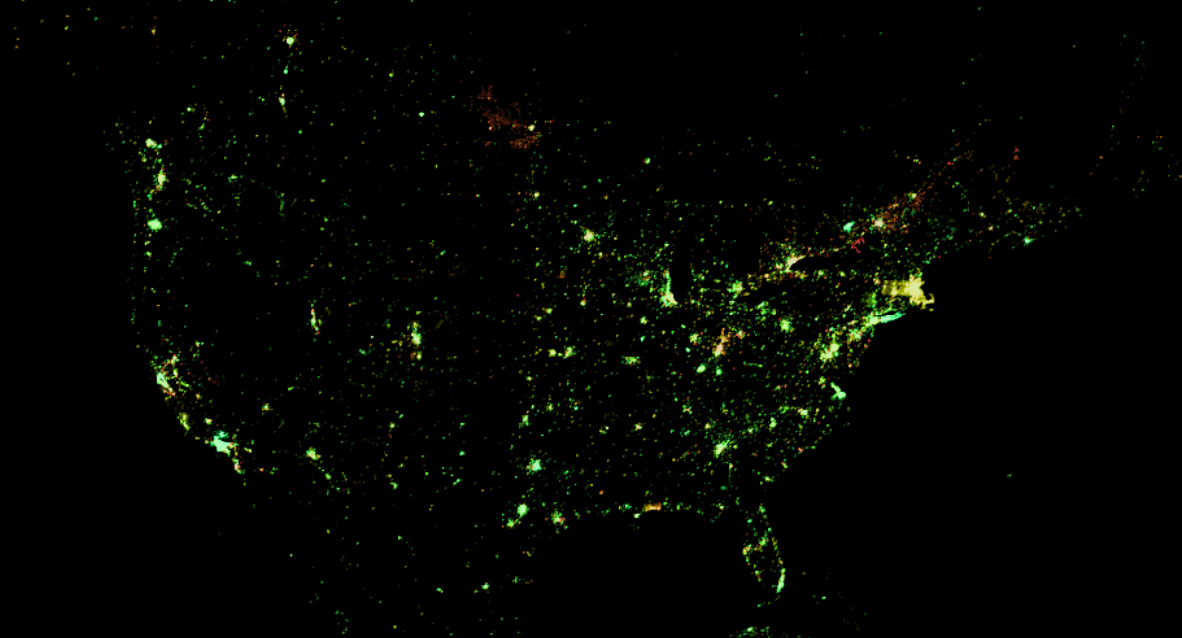
© OpenStreetMap Contributors
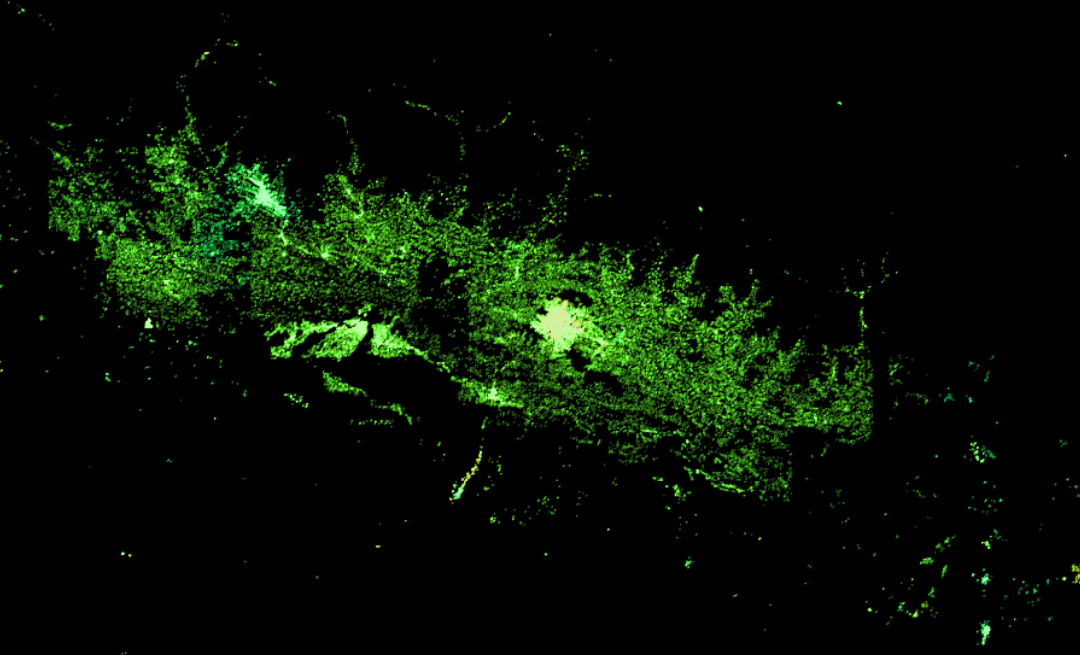
© OpenStreetMap Contributors
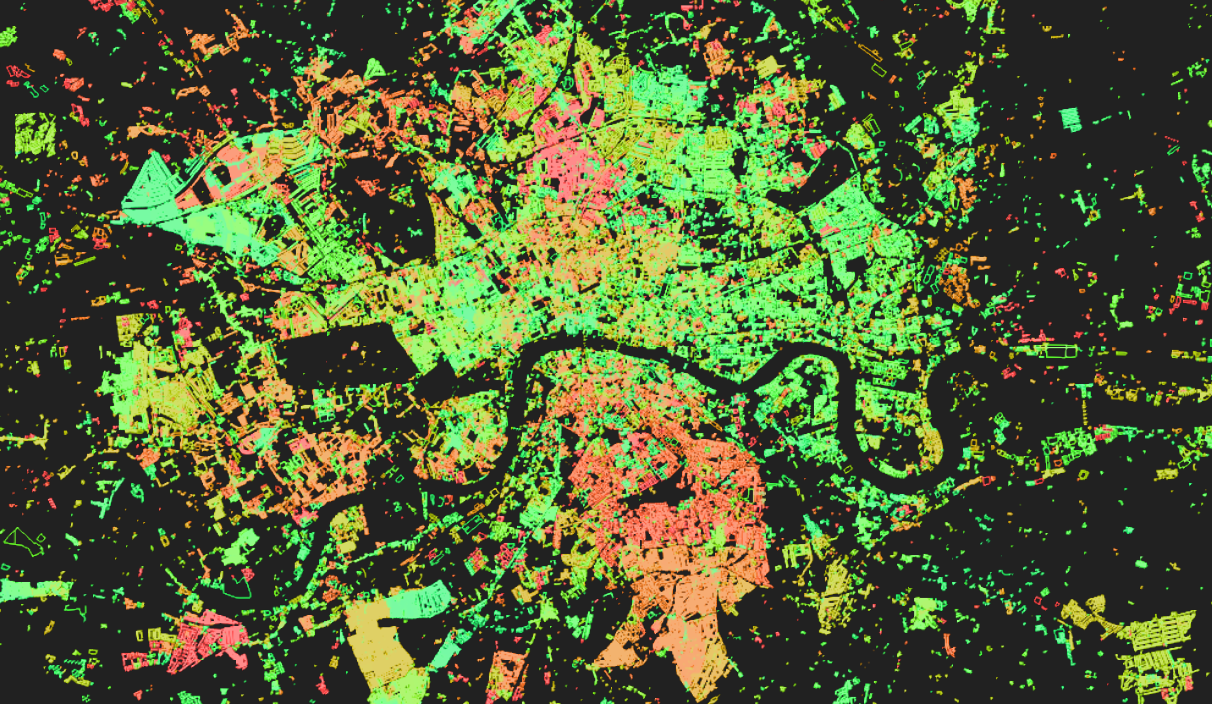
© OpenStreetMap Contributors
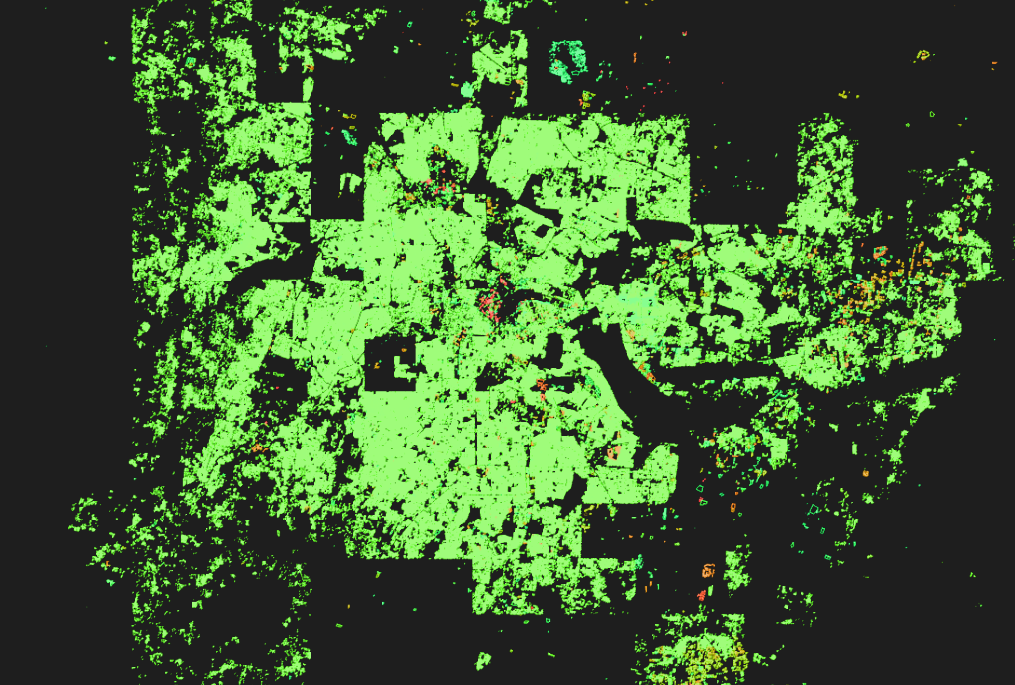
© OpenStreetMap Contributors
Contributor Centric OSM Analysis
To understand OSM, we must start where the map starts: the contributor
All contributors are users, but not all users are contributors
Count of Distinct User IDs in the planet history:
879,864With less than 10 edits:
285,231Less than 100 edits:
562,889(Note, a square building = 5 edits: 1 way and 4 nodes)
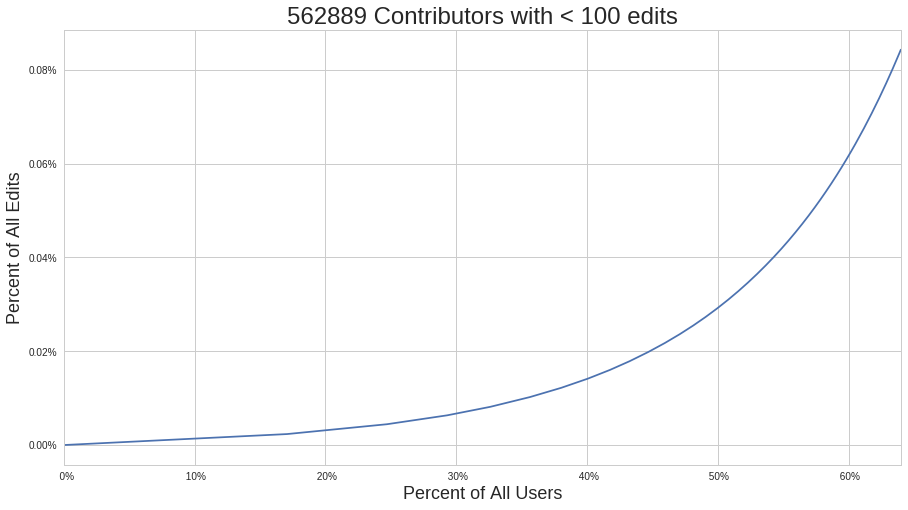
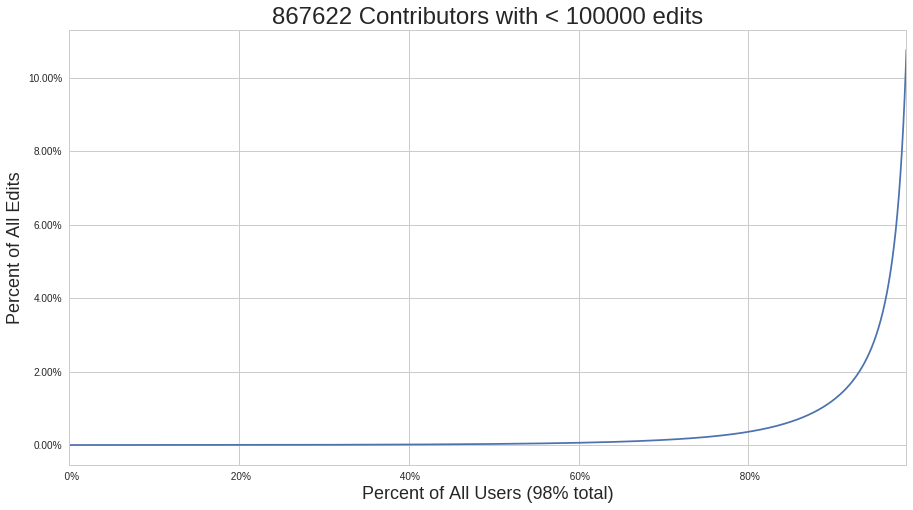
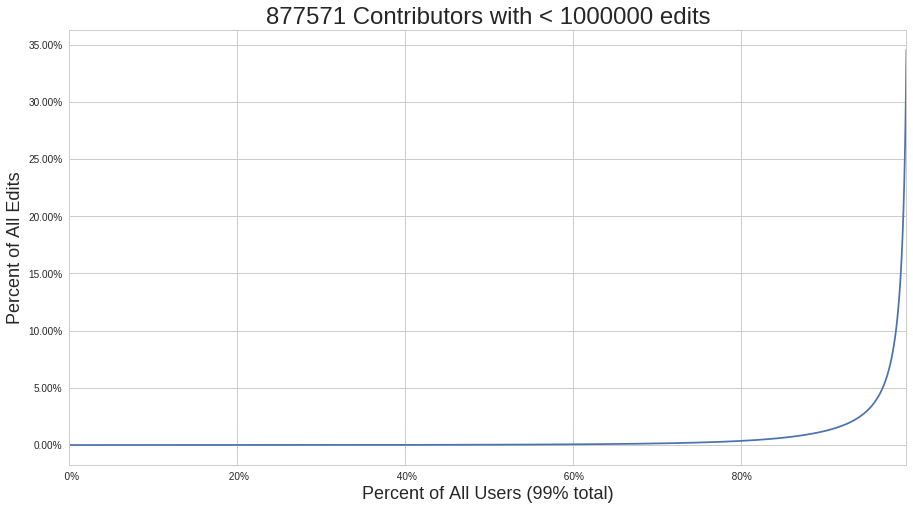
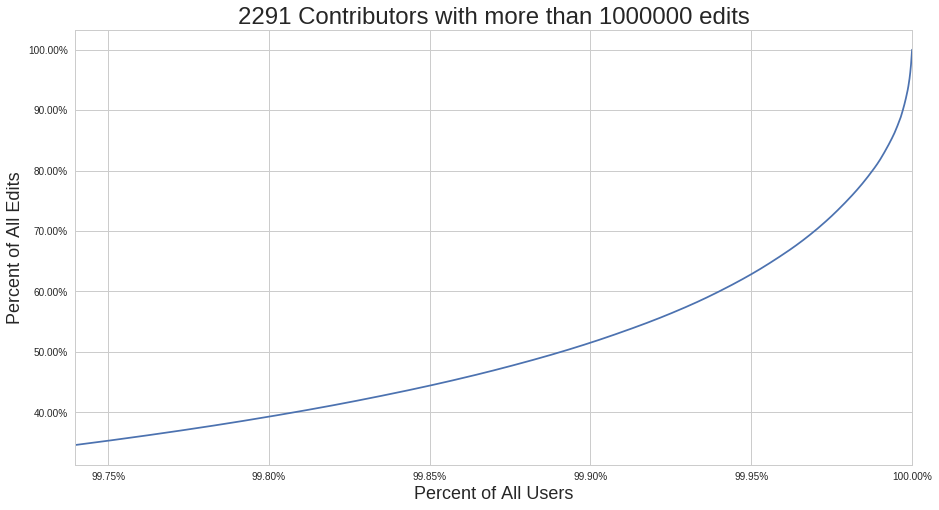
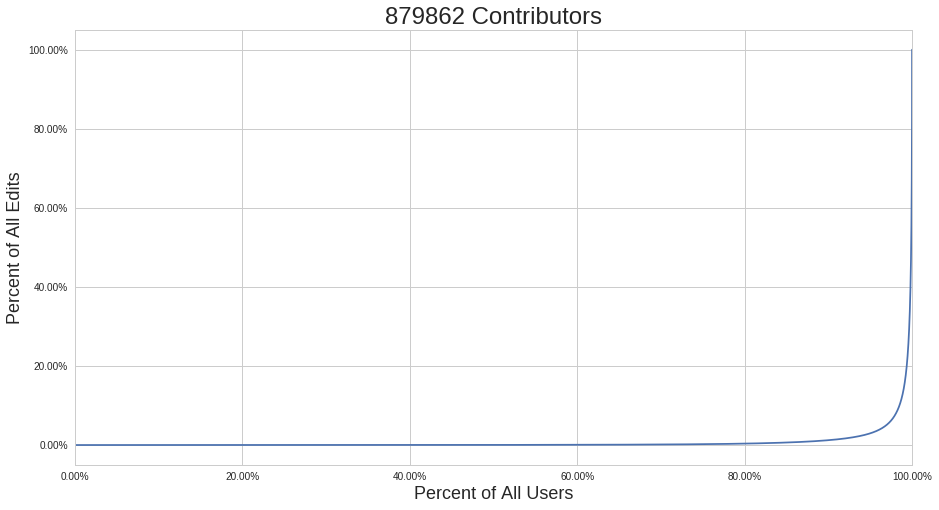
Editing Histories
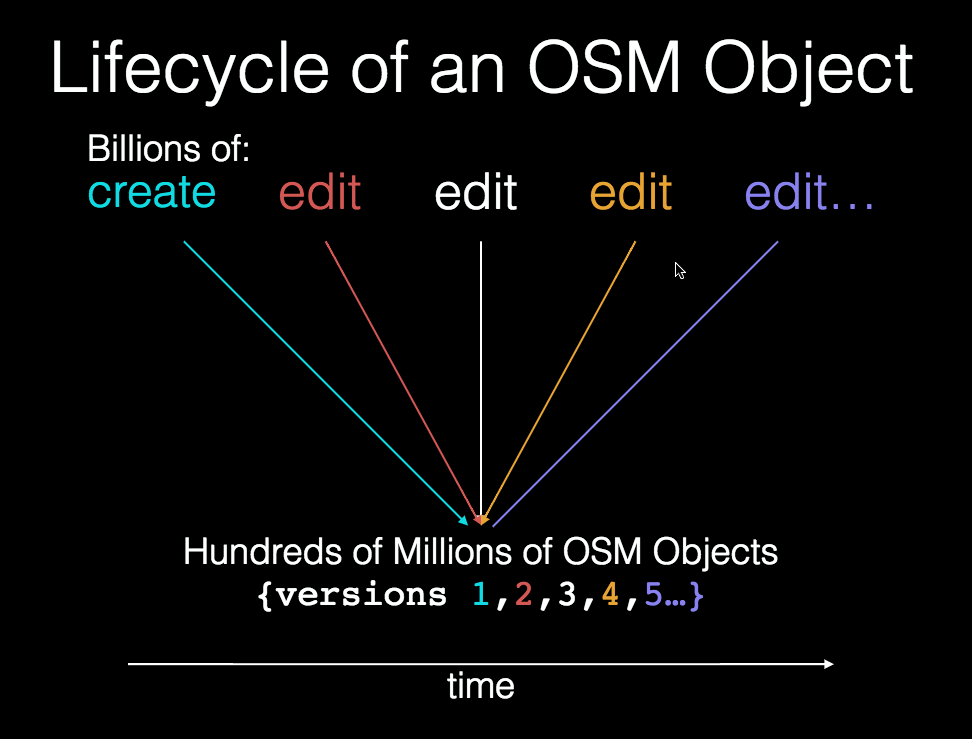
More details on the technical approach...
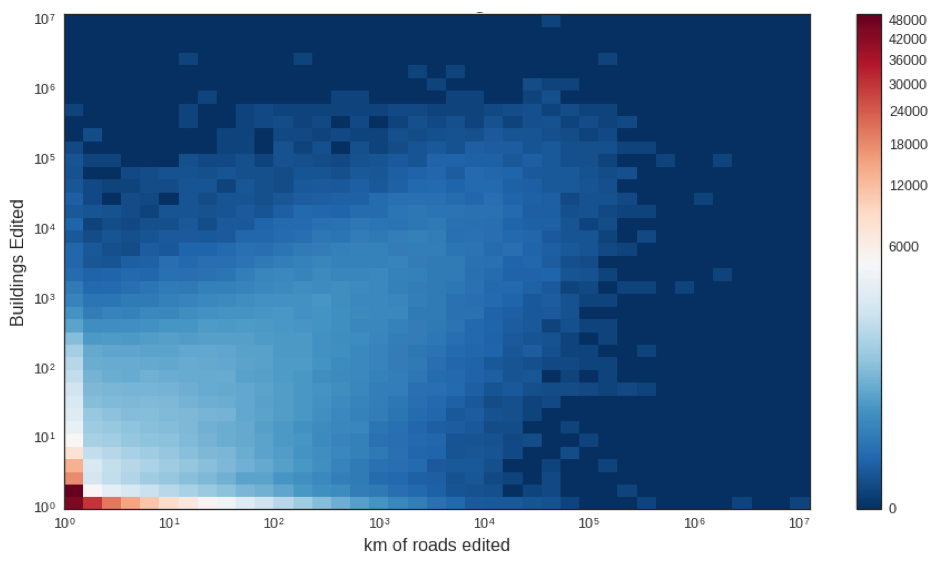
Not all contributions are equal
(clearly)
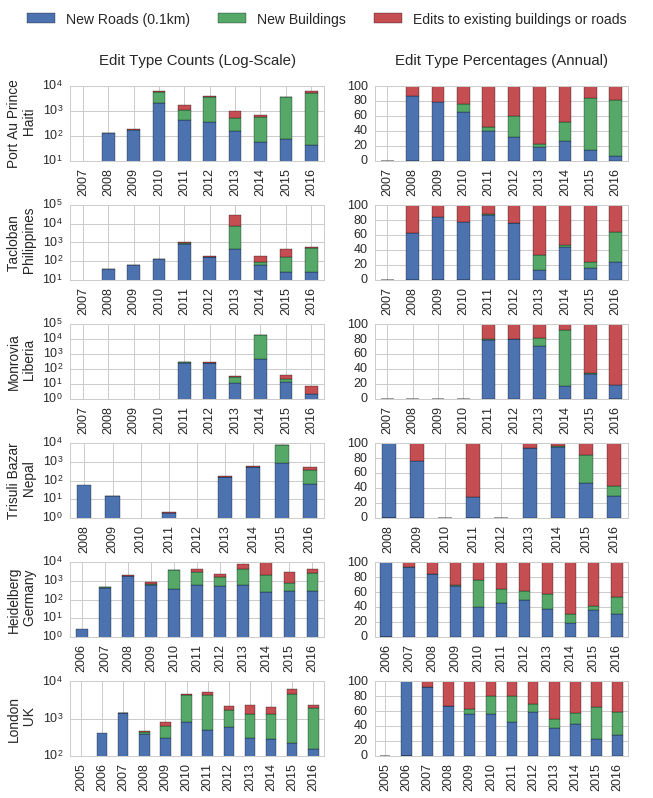
What about Disaster Mapping?OSM Quality Implications + Disaster Mapping
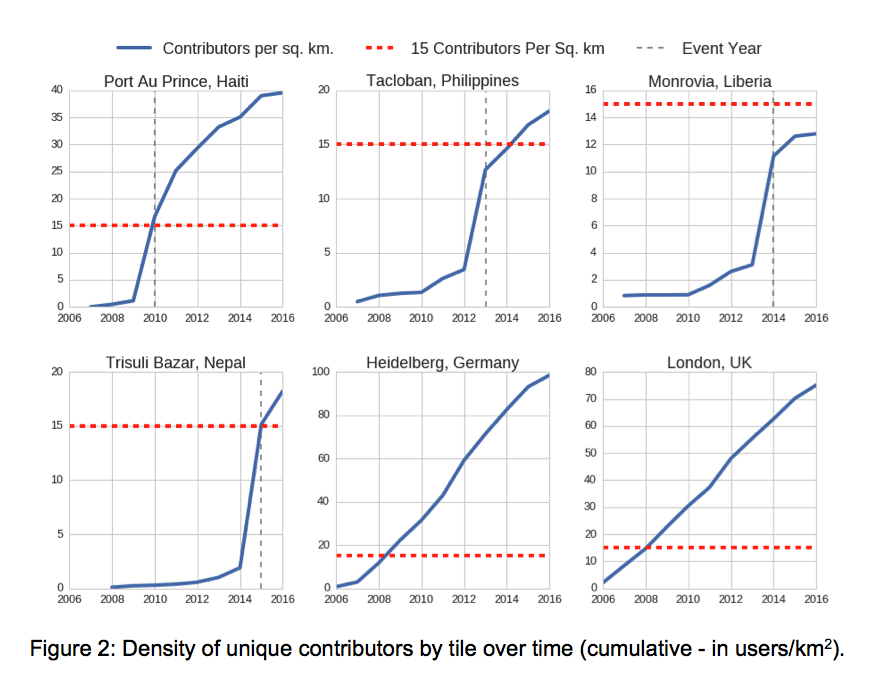
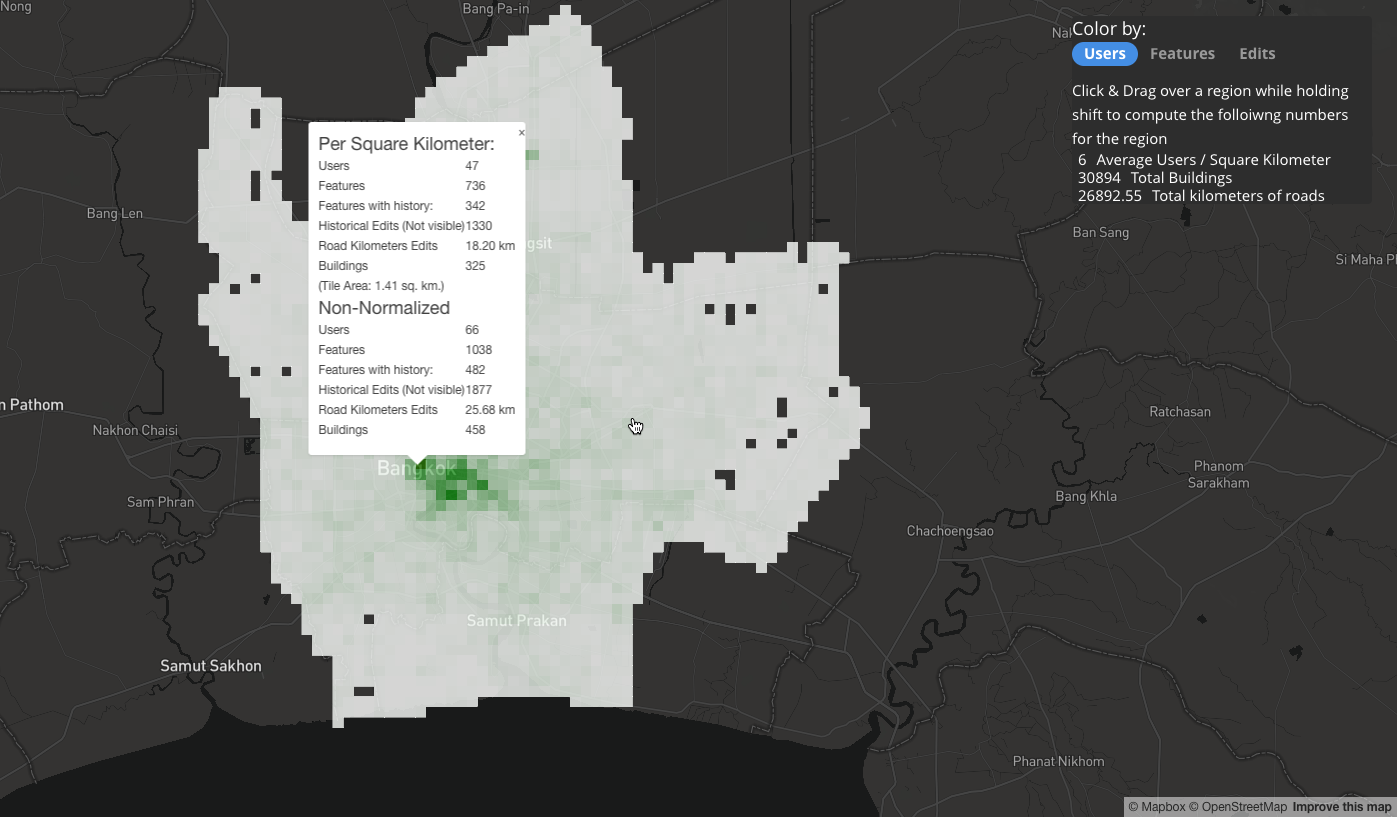
15 Contributors / Square Kilometer
Buildings & Roads?
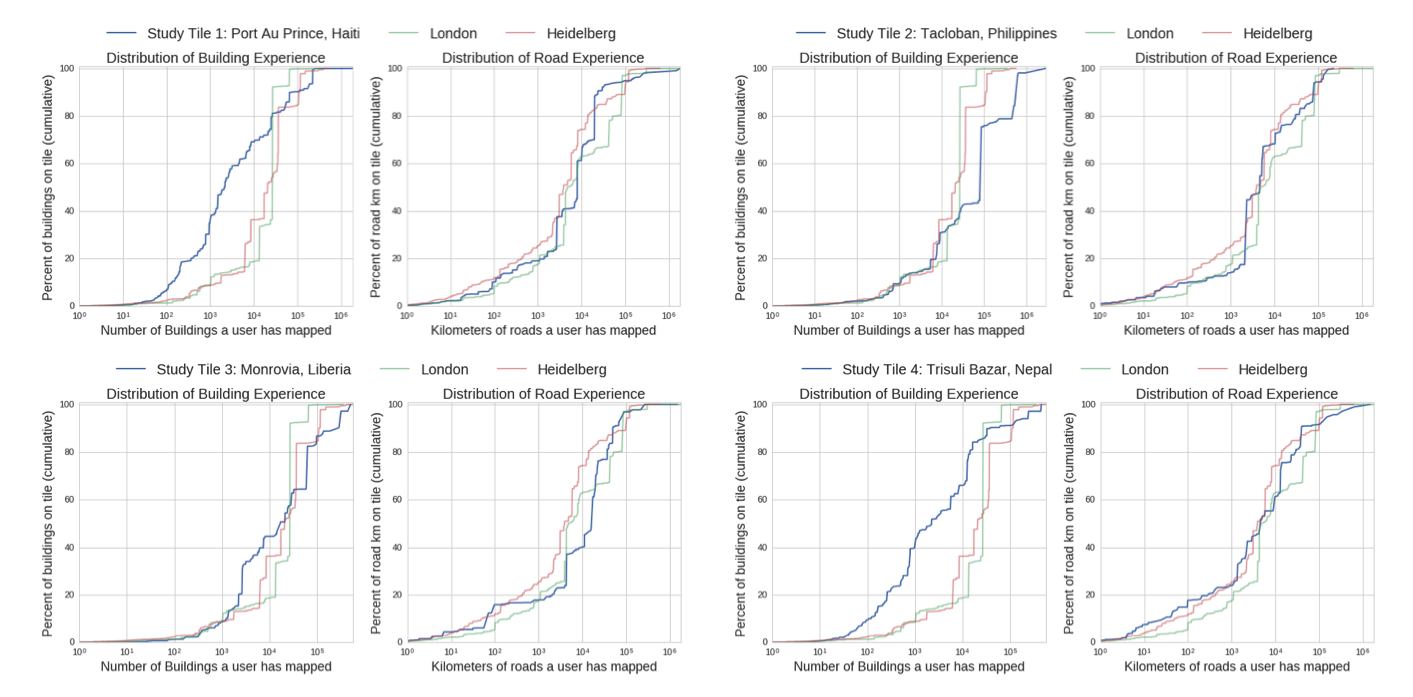
What about compared to high quality regions?
Users By Country
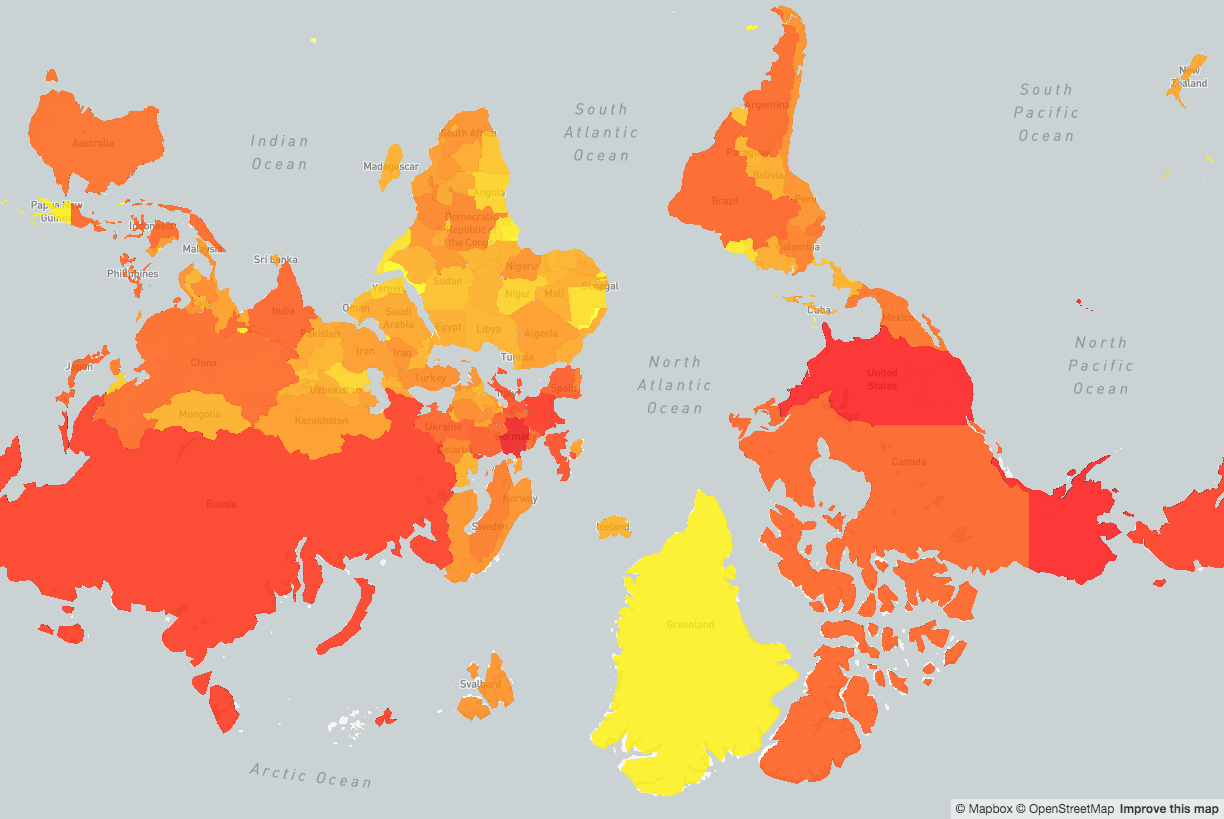
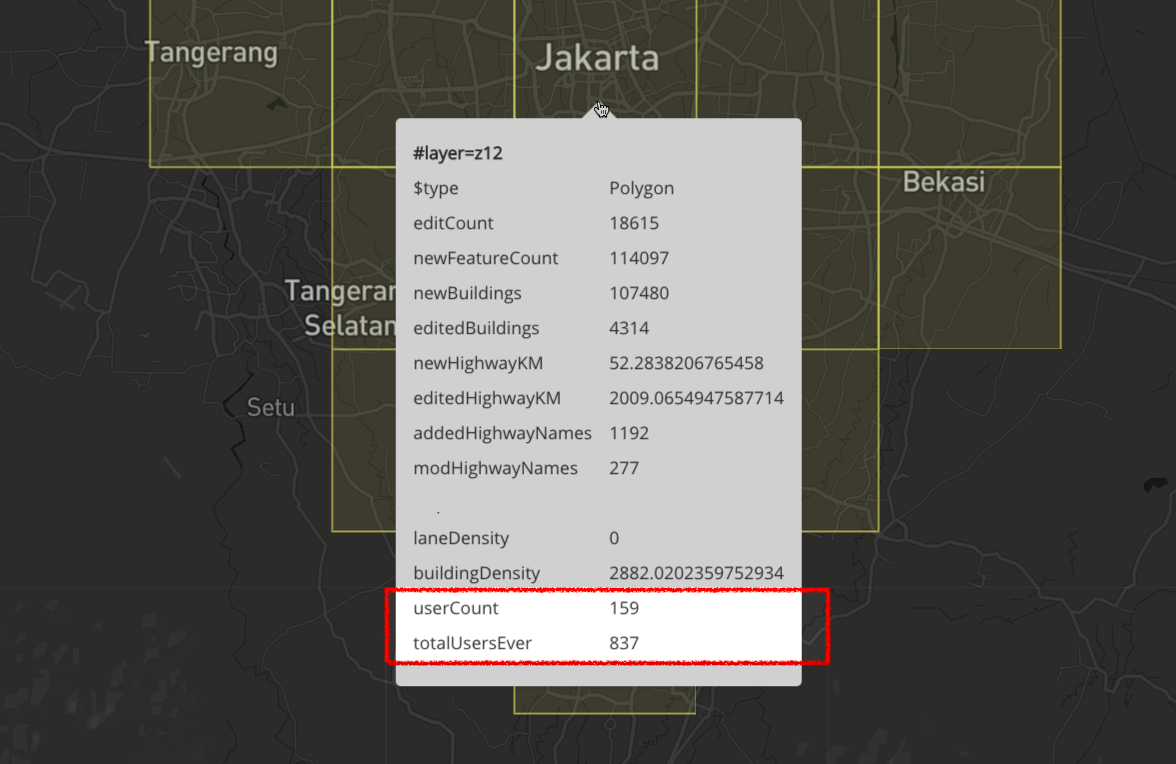
Using the latest osm-qa-tile planet file, we can calculate per-Country statistics for the planet in not a lot of time!
Users By Country
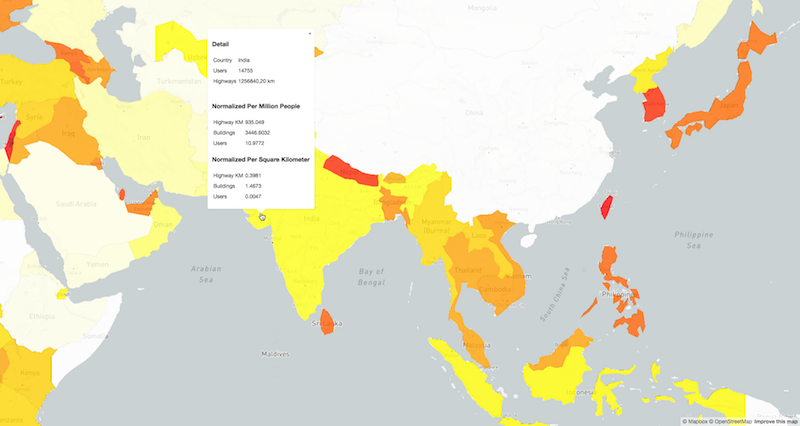
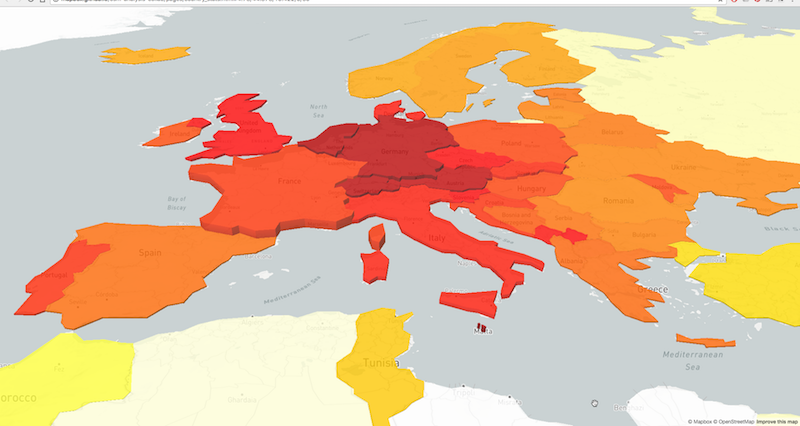
Where are the Contributions?
Mapbox Data Team
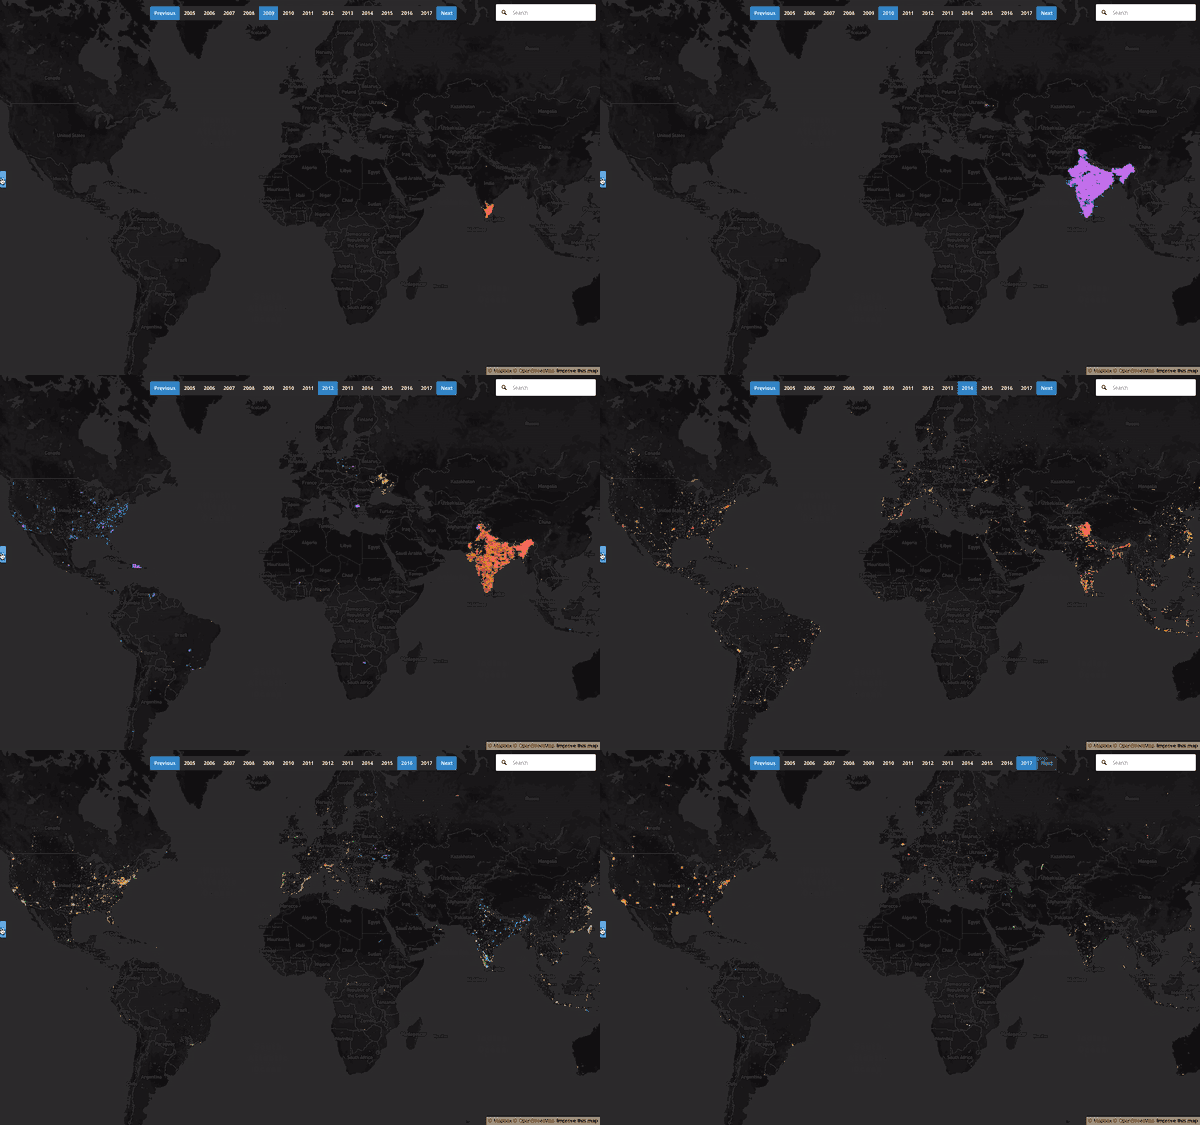
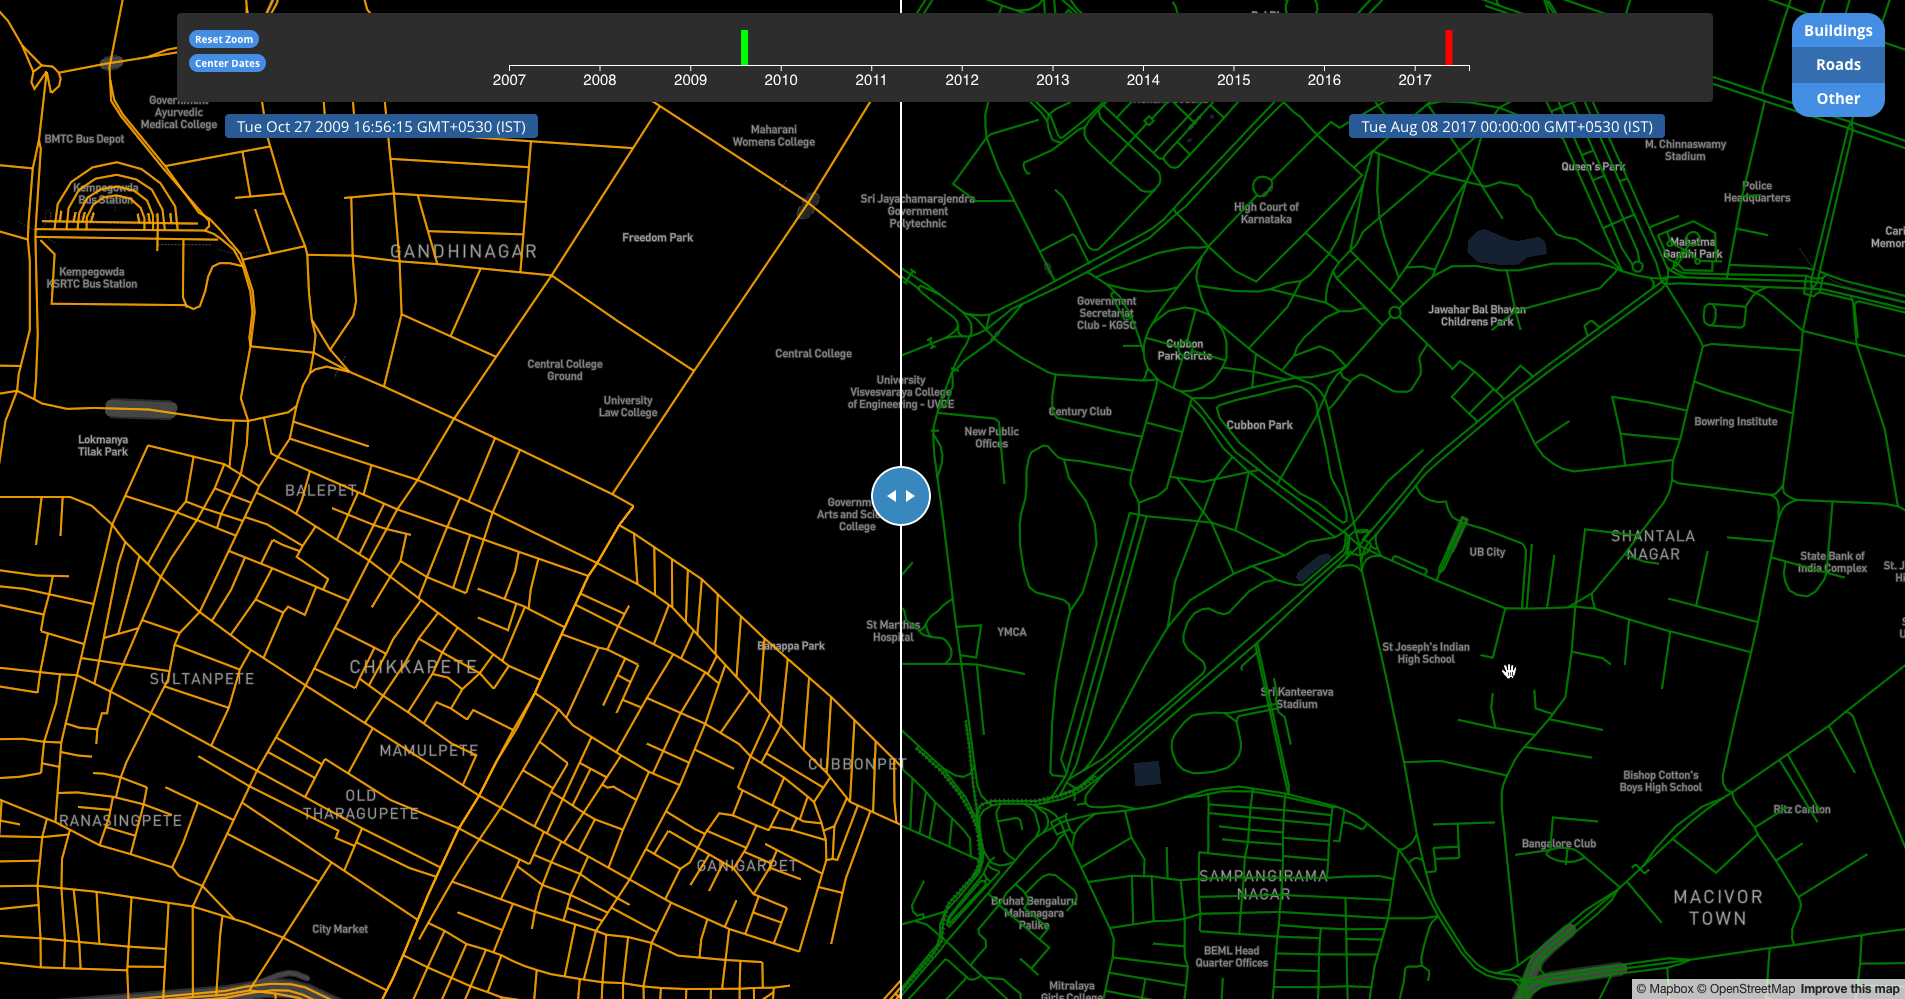
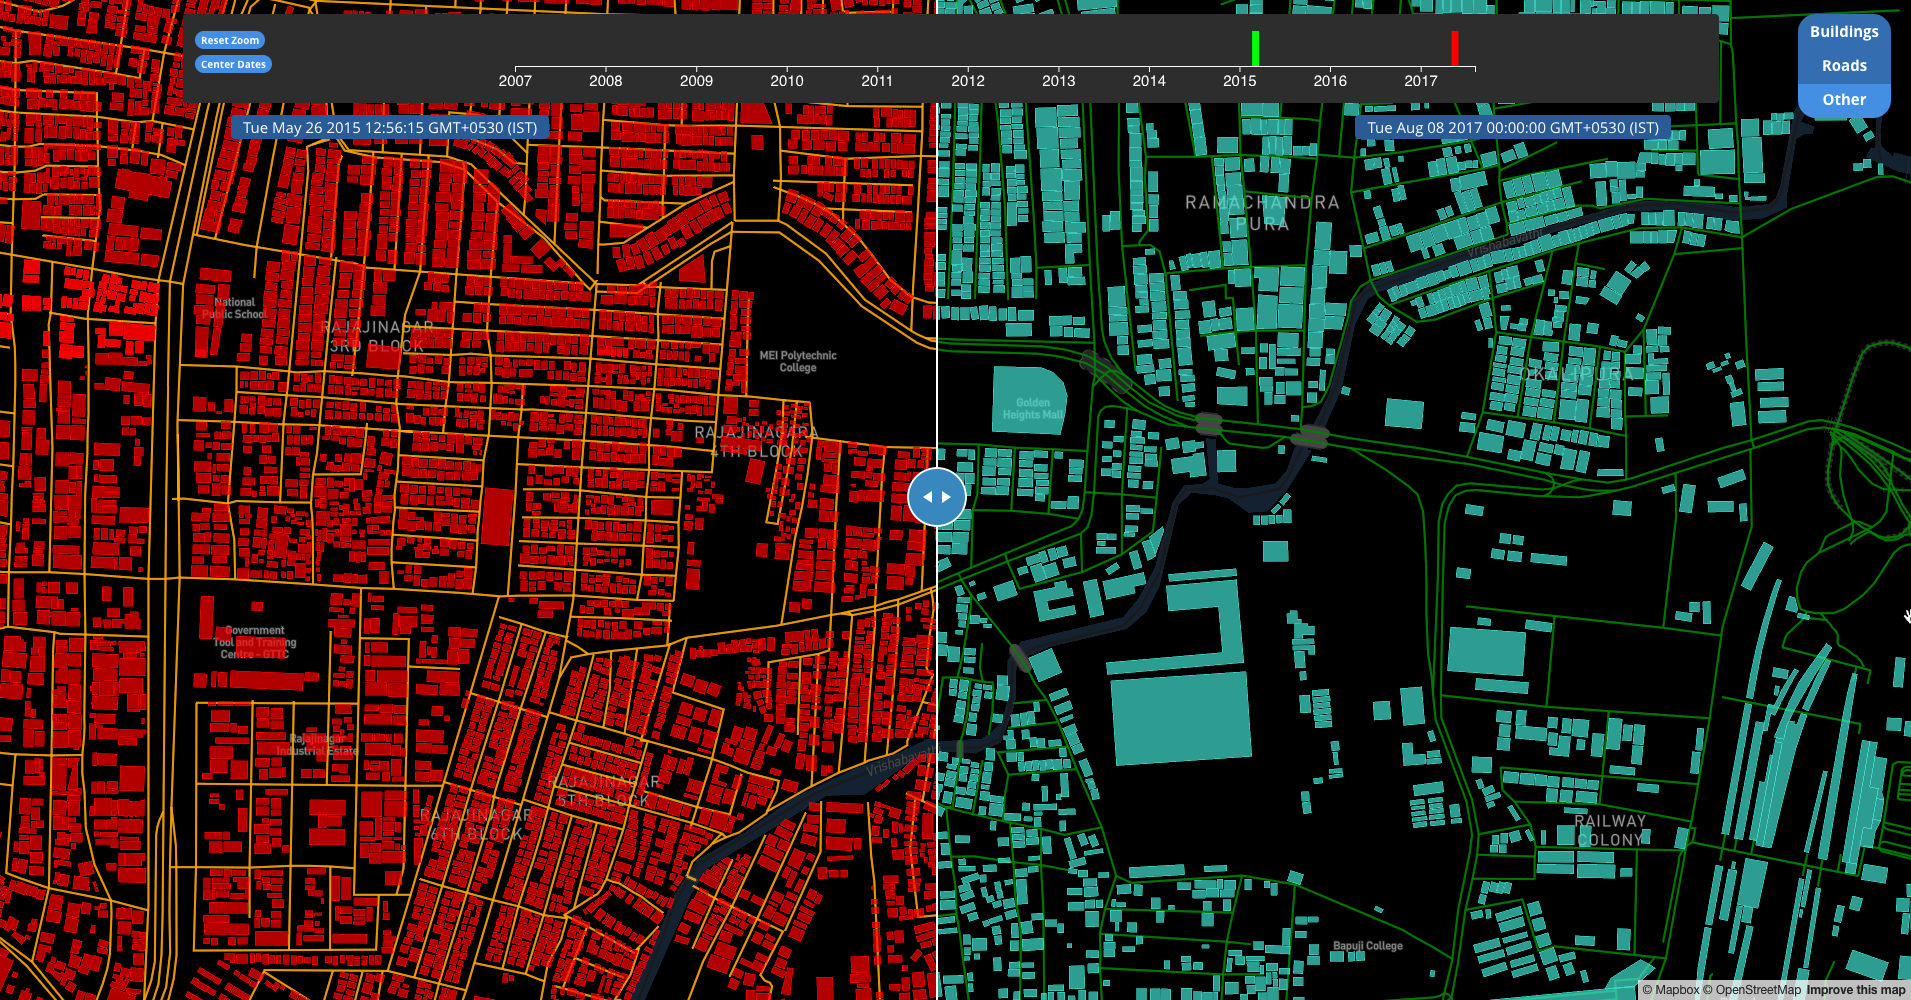
Individual Contributor Histories
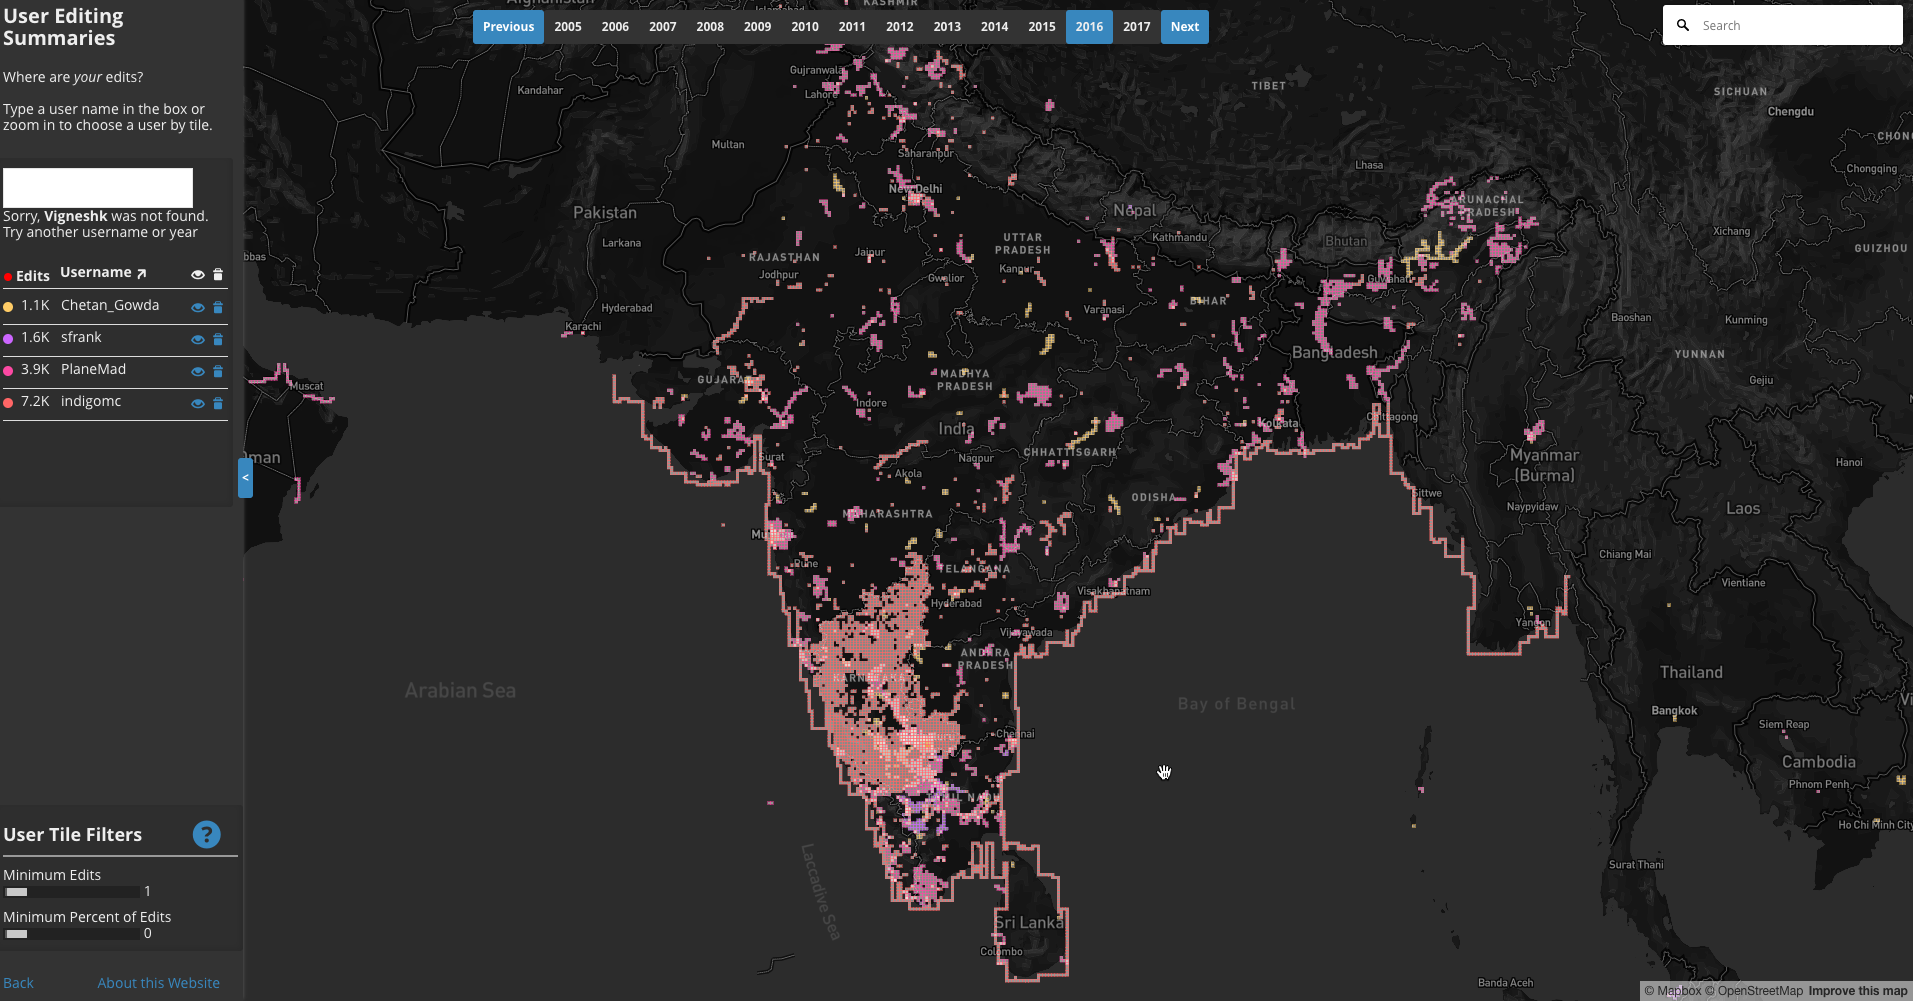
Importance of History
