Newest Statistics
Current Summary Statistics
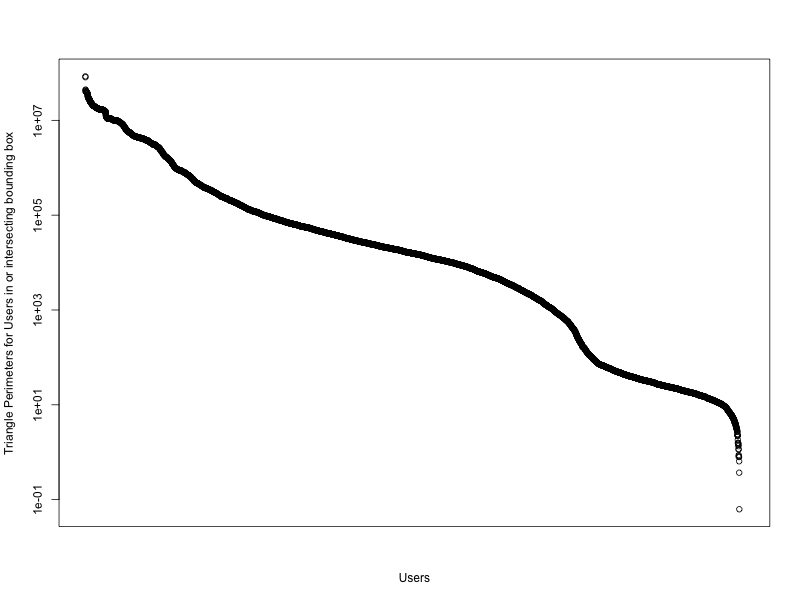
Triangle Perimeter Graph
Identifying a natural break in perimeter length could determine a decent threshold between shelter-in-place and some type of movement.
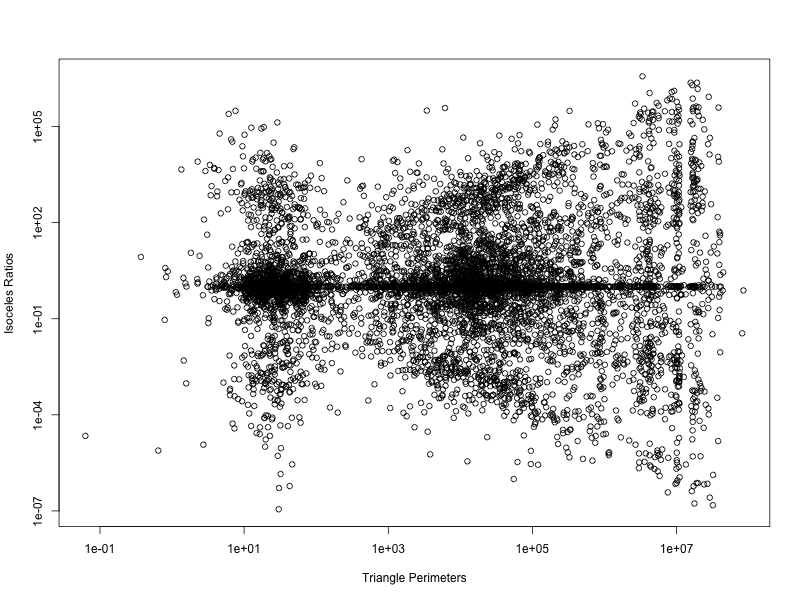
Isoceles Ratio vs. Triangle Perimeters
Looking at all users which either intersected with or had their before shelter location within the bounding box.
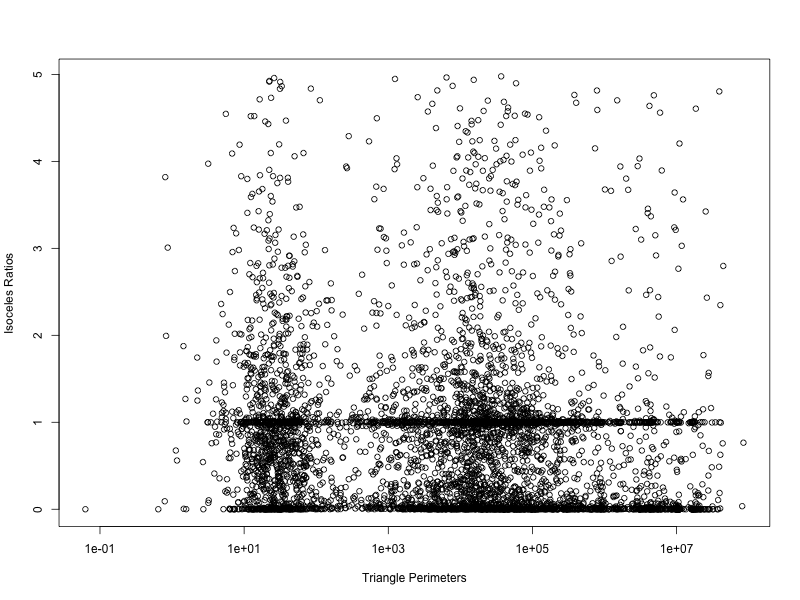
Looking much closer (not log scale on y-axis anymore), we see there is definately a break around 800 meters or so in the perimeters, implying a decent threshold value here. More interestingly, there is a lot of clustering around an isoceles ratio of 1, implying that a lot of people return to from where they left.
User Tweets Distribution by bin:
Triangles!
How does this compare for evacuators, etc?