Current Datasets
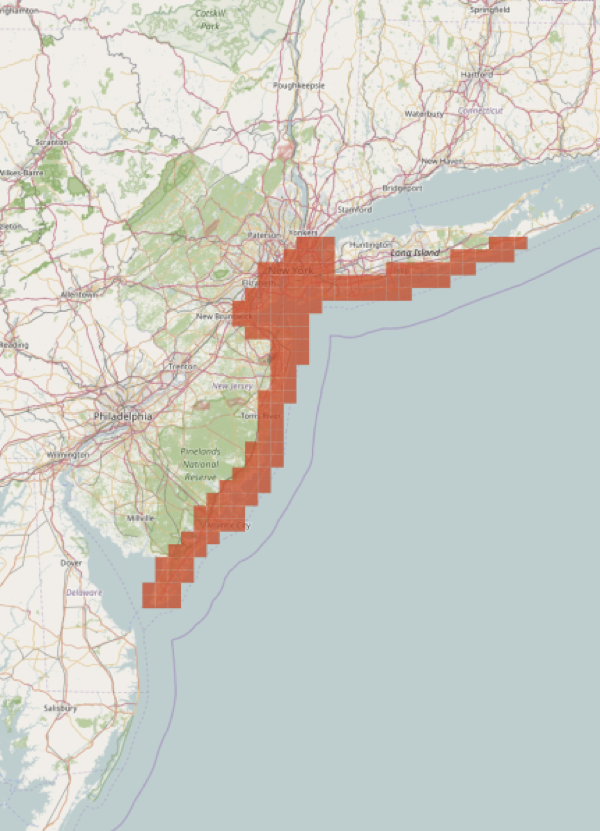
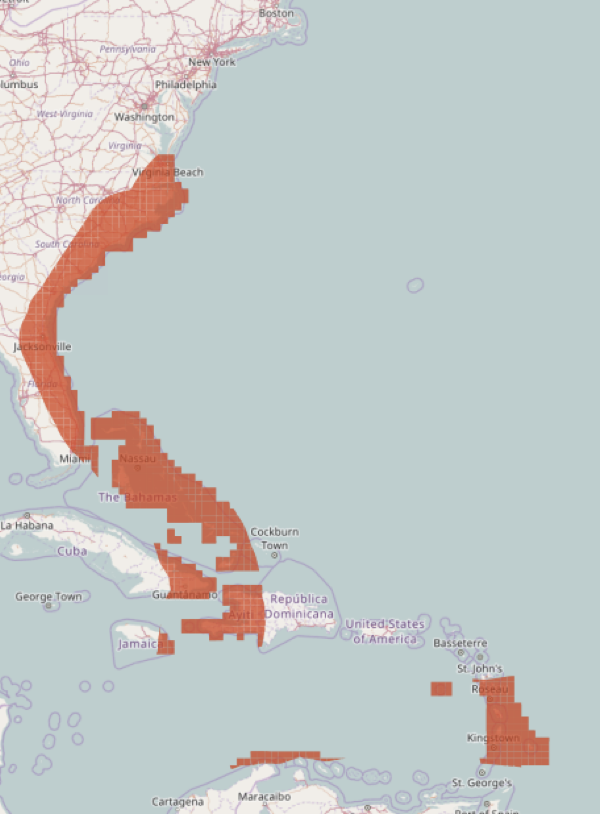
Hurricane Sandy | Hurricane Matthew |
|
|
| 3,632,625 tweets | 1,017,795 tweets |
Determining Home Locations
Determining the home locations of users requires a two stage clustering approach, spatially and then temporally. The first step uses the DBScan clustering algorithm to cluster all of the tweets for a single user.
DBScan
Here are a user’s tweets on Manhattan before and after clustering

|

|
DBScan is chosen because it does not require a predetermined numbrer of clusters and allows for null clusters. (There are not clusters for EVERY point). Many users have single sporadic points (like tweeting from a bus route).
Example: More movement in October during Sandy
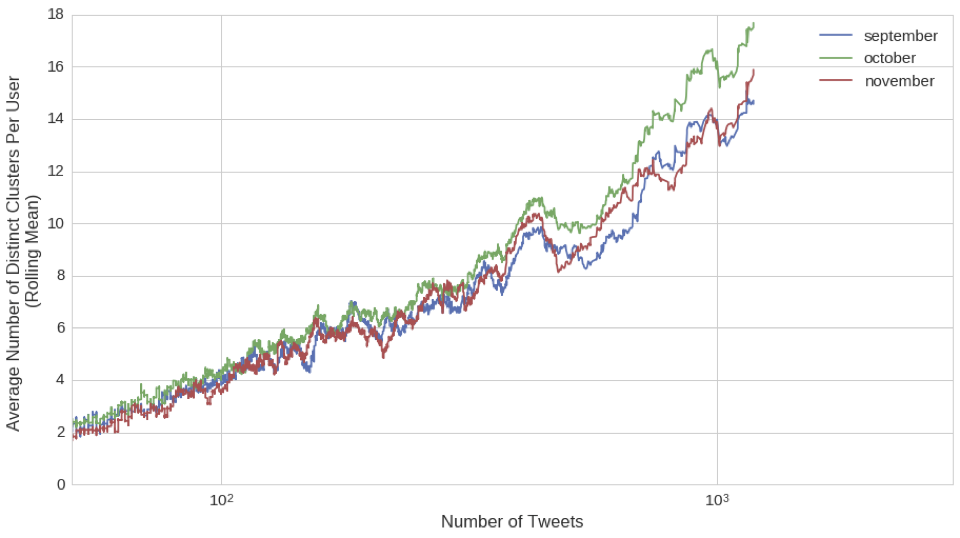
More geographic clusters on average during October. This could imply more movement.
Home Times
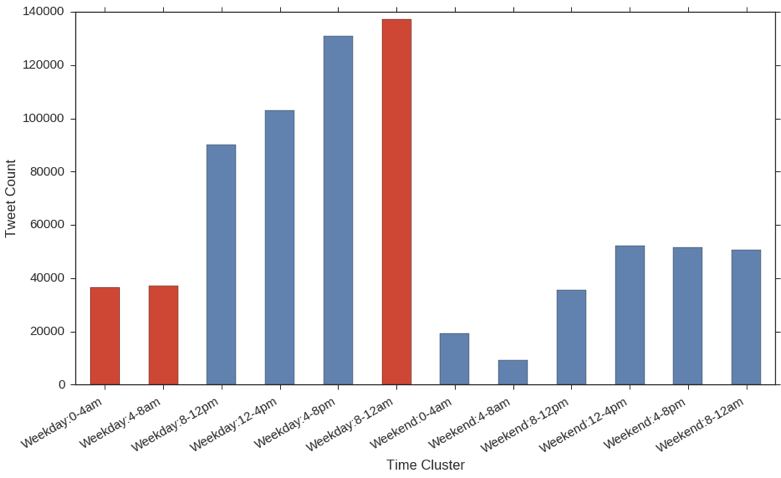
Binning by time, we can separate the tweets into these 12 bins. The times highlighted in red here represent times where the users are likely to be at home.
Likely Home Location
Identifying the spatial cluster with the most activity during the likely home times yields the likely home location for a user.
Geographically Vulnerable
Users are considered geographically vulnerable if the home location falls within an area known to be geographically at risk, an evacuation zone, for example.
Retrieving Contextual Streams
Once a user is considered geographically vulnerable, we pull their full contextual streams (and then re-run them through the clustering methods)
Qualitative Framework
Individual users are written to single geojson files which are then loaded into our qualitative investigation tool. The tweets are shown on the left while the user’s movement path is shown on the right. Clicking on a specific tweet allows you to see the tweet content.
Using this framework, we go through each user by hand and classify them as shelter-in-place or evacuated.
Results
- Home Locations deemed accurate for 81% of coded users
- Secondary evacuation vs. primary evacuation? What’s the difference with Matthew: Much cleaner to date